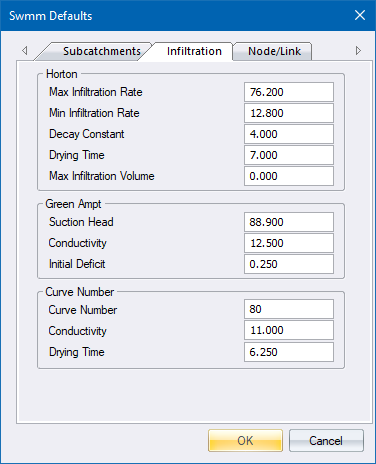
Home > Default Settings - Infiltration

Sets default infiltration values for newly created subcatchments.
|
Option
|
Description |
|
Horton |
|
|
Max Infiltration Rate |
Maximum infiltration rate on the Horton curve (mm/hr or in/hr). |
|
Min Infiltration Rate |
Minimum infiltration rate on the Horton curve (mm/hr or in/hr). Equivalent to the saturated hydraulic conductivity. See the Soil Characteristics Table for typical values. |
|
Decay Constant |
Infiltration rate decay constant for the Horton curve (1/hours). Typical values range between 2 and 7. |
|
Drying Time |
Time in days for a fully saturated soil to dry completely. Typical values range from 2 to 14 days. |
|
Max Infiltration Volume |
Maximum infiltration volume possible (mm or inches, 0 if not applicable). Can be estimated as the difference between a soil's porosity and its wilting point, multiplied by the depth of the infiltration zone. |
|
Green Ampt |
|
|
Suction Head |
Average value of soil capillary suction along the wetting front (mm or inches). |
|
Conductivity |
Soil saturated hydraulic conductivity (mm/hr or in/hr). |
|
Initial Deficit |
Difference between soil porosity and initial moisture content (a fraction). The initial deficit for a completely drained soil is the difference between the soil's porosity and its field capacity. |
|
Curve Number |
|
|
Curve Number |
This is the SCS curve number, which is tabulated in the publication SCS Urban Hydrology for Small Watersheds, 2nd Ed., (TR-55), June 1986. Consult the SCS Runoff Curve Numbers Table for a listing of values by soil group, and the accompanying Soil Group Table for the definitions of the various groups. |
|
Conductivity |
This is the SCS curve number, which is tabulated in the publication SCS Urban Hydrology for Small Watersheds, 2nd Ed., (TR-55), June 1986. Consult the SCS Runoff Curve Numbers Table for a listing of values by soil group, and the accompanying Soil Group Table for the definitions of the various groups. |
|
Drying Time |
The number of days it takes a fully saturated soil to dry. Typical values range between 2 and 14 days. |
See Also SWMM Defaults