Home > Water Mode > Data > Summary
Display a summary of the network data.
|
Icon |
Command |
Shortcut Key |
Toolbar |
|
|
WATERDATASUMMARY |
|
|
This function allows you to display a detailed summary of all the components of your network.
You can also display a summary of components in a group by selecting the group in the Group dropdown list.
Procedure
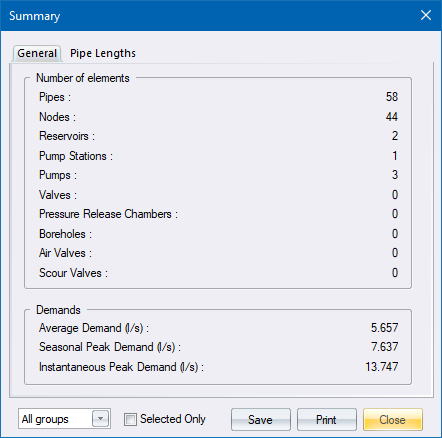
The General Summary lists the following:
Number of each element i.e. nodes, pipes, reservoirs, pump stations, pumps, valves and pressure release chambers.
Average Demand (l/s) - This is the total demand on the network without applying any demand pattern or peak factors.
Seasonal Peak Demand (l/s) - This is the total demand on the network multiplied by the peak factors.
Instantaneous Peak Demand (l/s) - This is the worst possible scenario where at each node, the demand is multiplied by the worst demand pattern factor as well as the peak factor, and added together to give a demand in l/s.

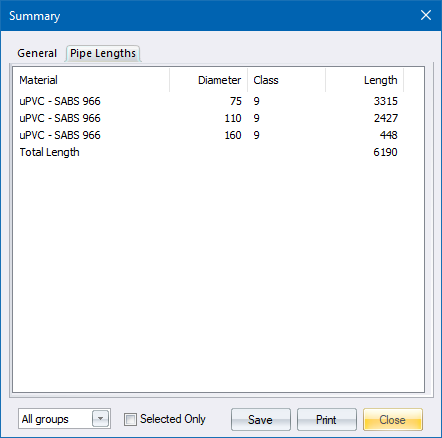
You can also view the Pipe Lengths page, which displays the pipe lengths in a tabular format, grouped by material, diameter and class.

You have the option to print the summary or save it to a text file.