Home > Storm Mode > View > Results
Display all the results.
|
Icon |
Command |
Shortcut Key |
Toolbar |
|
|
STORMVIEWTABRESULTS |
|
|
The results windows display the results of the analysis in a series of logical views.
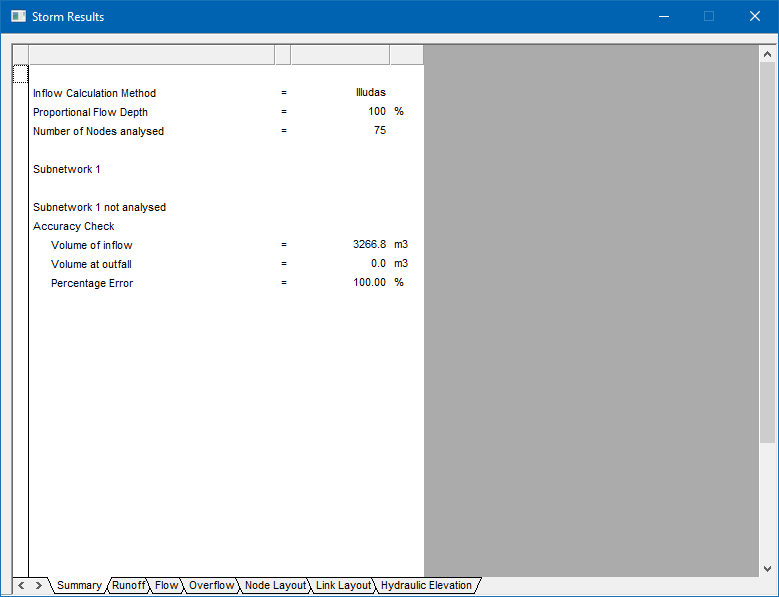
This tab displays a summary of the network analysis and includes the outfall node data. The example below is generated for the Illudas time area method.

Display the results of the runoff analysis.
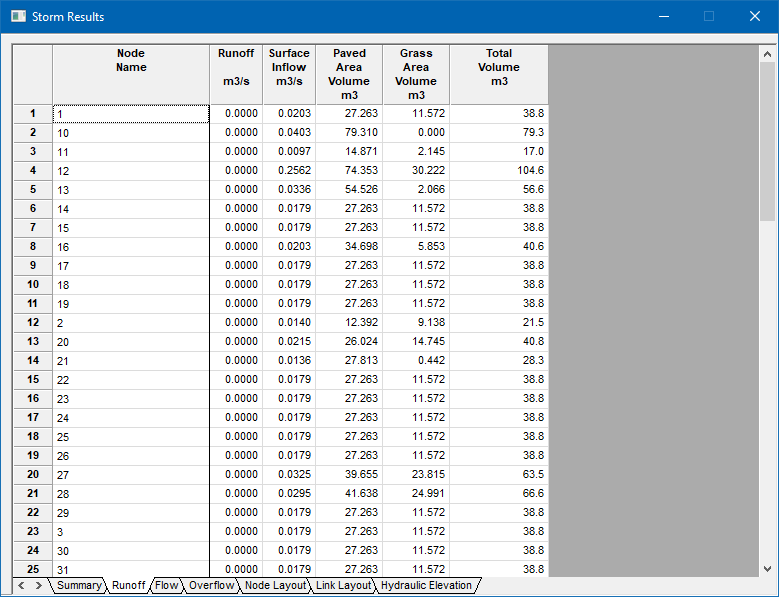
This tab displays the results data generated during the runoff analysis. The data varies according to the inflow method.
The data includes:
Node name
Next node name
Runoff in m3/s
The volume of runoff from the Paved Area in m3
The volume of runoff from the Grass Area in m3
The data includes:
Node name
Next node name
Runoff in m3/s
The rural runoff coefficient
The data includes:
Node name
Next node name
Runoff in m3/s
Catchment Area in km2
Percentage Impermeable in %
Time of Entry in minutes
Time of Flow in minutes
Display the results of the flow analysis.
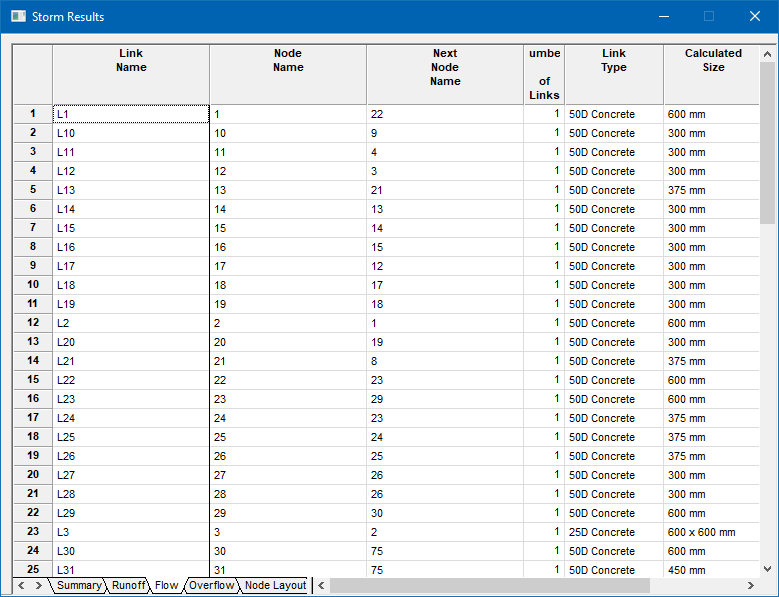
This tab displays the results generated by the flow or hydraulic analysis.
The data includes:
Link name
Next link name
Number of Links
Link type
Calculated size of the link
Flow in m3/s
Capacity of the link in m3/s
Velocity at peak flow in m/s
Display the results of the overflow analysis.
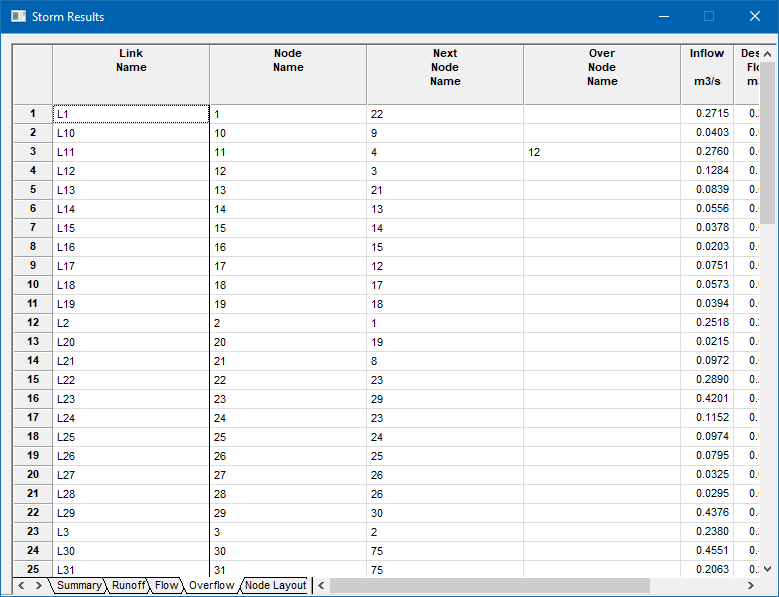
This tab displays the results generated by the overflow analysis.
The data items include:
Link name
Next link name
Inflow into the node in m3/s
Design flow in m3/s which is the total flow from all upstream catchment areas
Actual flow transported by the link in m3/s
Capacity of the link in m3/s
Overflow from the link in m3/s i.e. the difference between the design flow and the flow
The local storage required or used at the node in m3
Display the results of the node layout analysis.
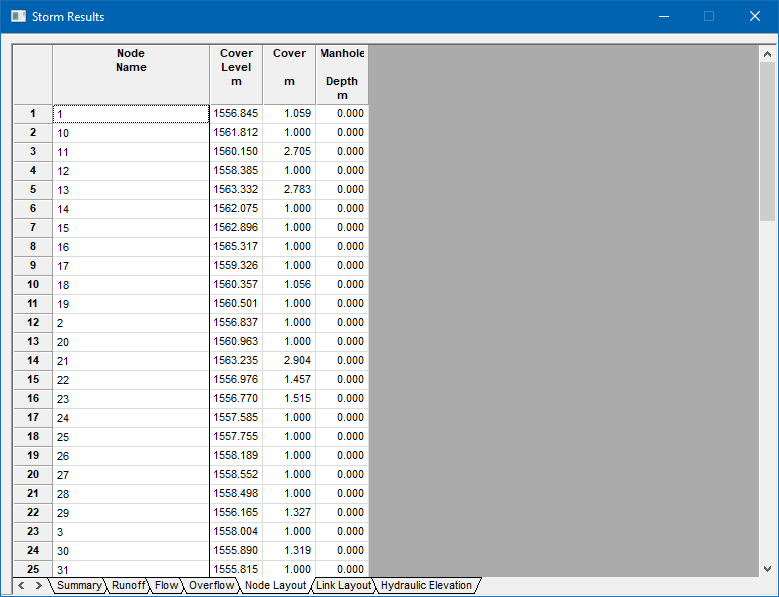
The data includes:
Node name
Cover level of the node
The actual cover to the incoming and outgoing links
The depth of the manhole
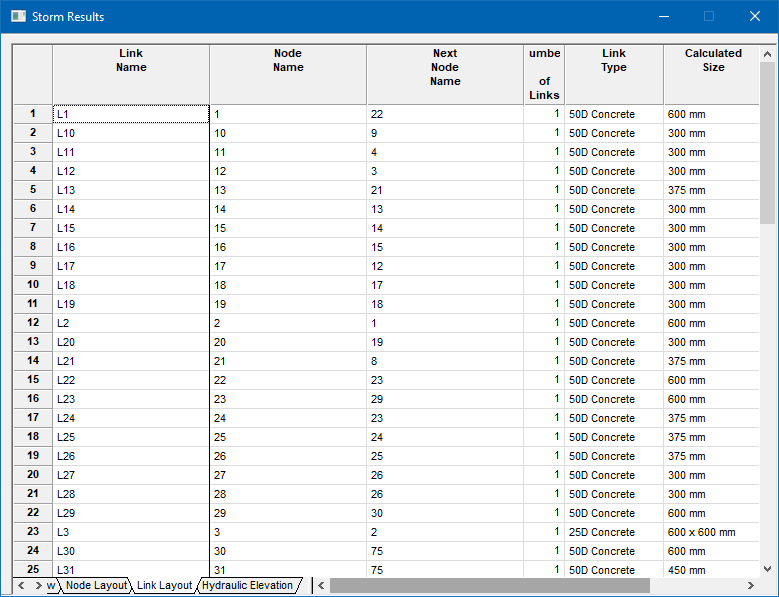
This tab displays data relating to the geometric position of the link.
The data includes:
Link name
Next link name
Number of links
Link type
Calculated size in mm or the link description
Length in m
Slope of the link expressed as a percentage
Slope of the link expressed as a Ratio
Inlet level of the link in m
Outlet level of the link in m
Cover Level of the link in m
Cover to the link in m
 If the slope of a link is less than the minimum slope specified in the Link Tables, it displays in red. Similarly, if the slope is greater than the maximum slope specified in the Link Tables, it displays in blue.
Display the results of the hydraulic grade analysis.
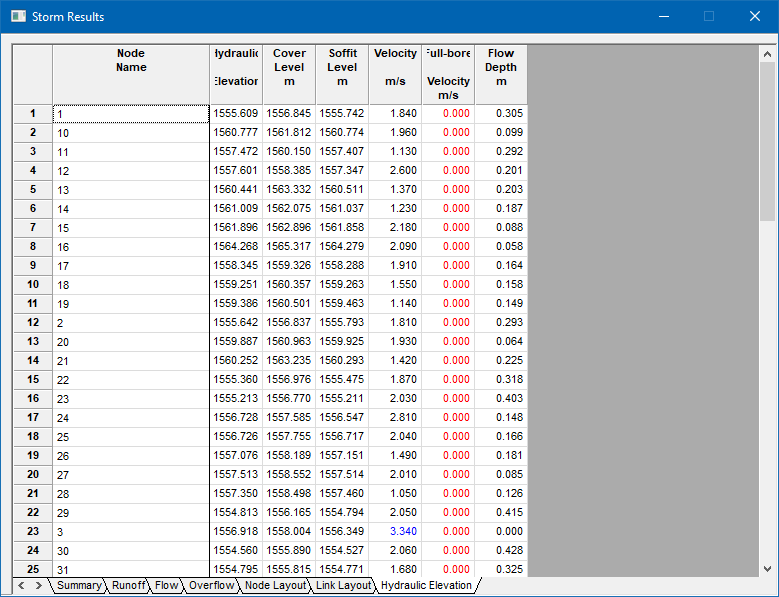
This tab displays the elevation of the hydraulic grade line, as well as other hydraulic control data.
The data includes:
Link name
Hydraulic grade in m
Cover level of the node (manhole) in m
Soffit level of the link in m
Velocity of flow in m/s
 If the link velocity is less than the minimum velocity specified in the Design Parameters, it displays in red. Similarly, if the velocity is greater than the maximum velocity specified in the Design Parameters, it displays in blue.