Home > Sewer Mode > View > Results
Display all the results.
|
Icon |
Command |
Shortcut Key |
Toolbar |
|
|
SEWERVIEWTABRESULTS |
|
|
The Results windows display the results of the analysis in a series of logical views.
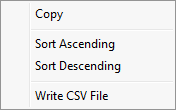
You can sort the data on any column of the spreadsheets, except the Summary page, using the right-click context menu.

|
Option
|
Description |
|
Copy |
Copy the selected spreadsheet cells to the Windows Clipboard. |
|
Sort Ascending |
Sort the table data on the values of the selected column in ascending order. |
|
Soft Descending |
Sort the table data on the values of the selected column in descending order. |
|
Write CSV File |
Output the selected spreadsheet in CSV (comma delimited) format to a text file. |
Procedure
The results of the last analysis display in a series of tables.
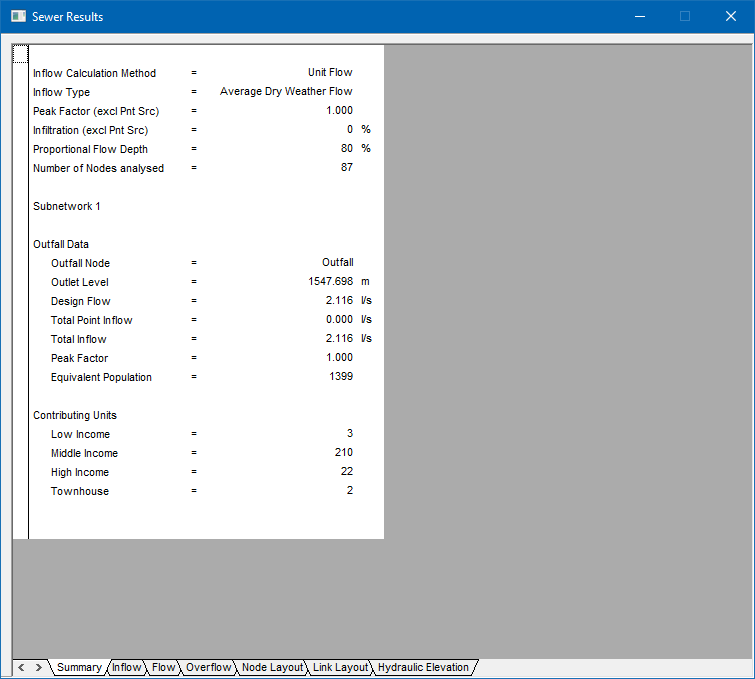
This function displays a summary of the network analysis and includes the outfall node data. The example below is generated for the Unit Flow method.
This function displays the results data generated during the inflow analysis. The data displayed varies according to the inflow method.
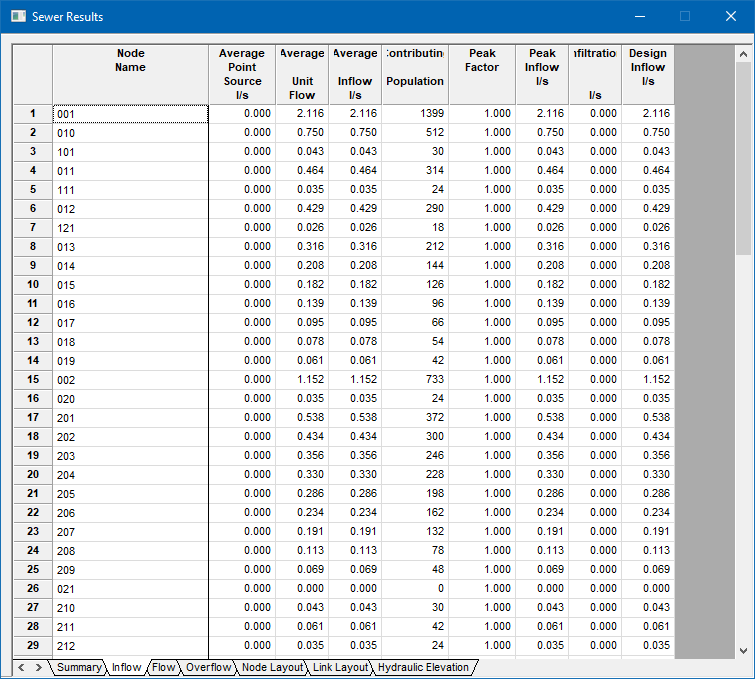
The data includes:
Node name
Average point source inflow into the node in l/s
Average Unit Flow inflow into the node in l/s
The sum of the point source and unit class inflows in l/s
Contributing or equivalent population
Peak factor as determined from the attenuation curve or as specified
The peak inflow from all contributing culverts upstream of this node excluding infiltration in l/s
Total Infiltration from all contributing culverts upstream of this node in l/s
Design inflow in l/s
The data includes:
Node name
Total point source inflow in l/s
Contributing units
Contributing population
Average flow in l/s
Harmon Peak Factor
Peak Inflow in l/s
Infiltration in l/s
Design Inflow in l/s
The data includes:
Node name
Design inflow in l/s
This function displays the results generated by the flow or hydraulic analysis.
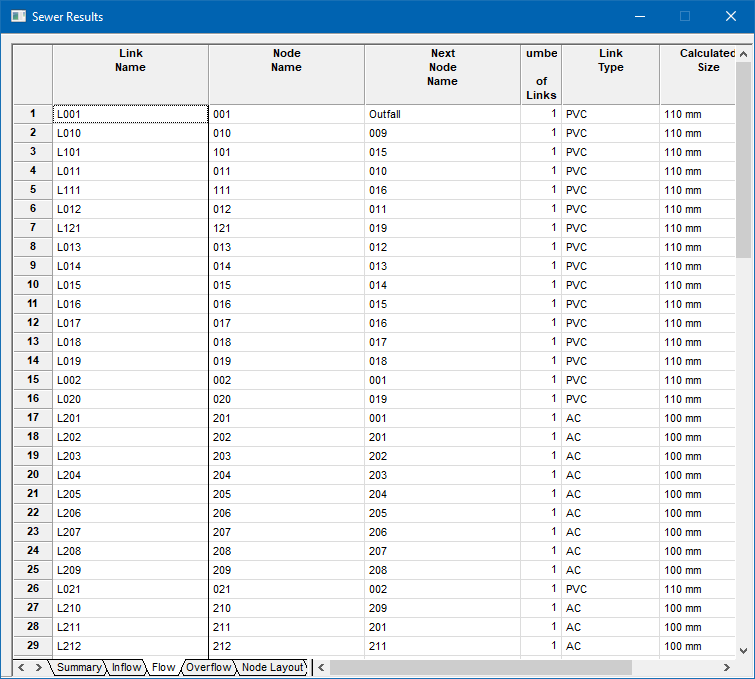
Data items include:
Link name
Node name
Next node name
Number of Links - how many parallel links
Link type
Calculated size of the link
Flow in l/s
Capacity of the link at the specified proportional flow depth in l/s
Velocity at peak flow in m/s
Flow depth expressed as a percentage of the link size
This function displays the results generated by the overflow analysis.
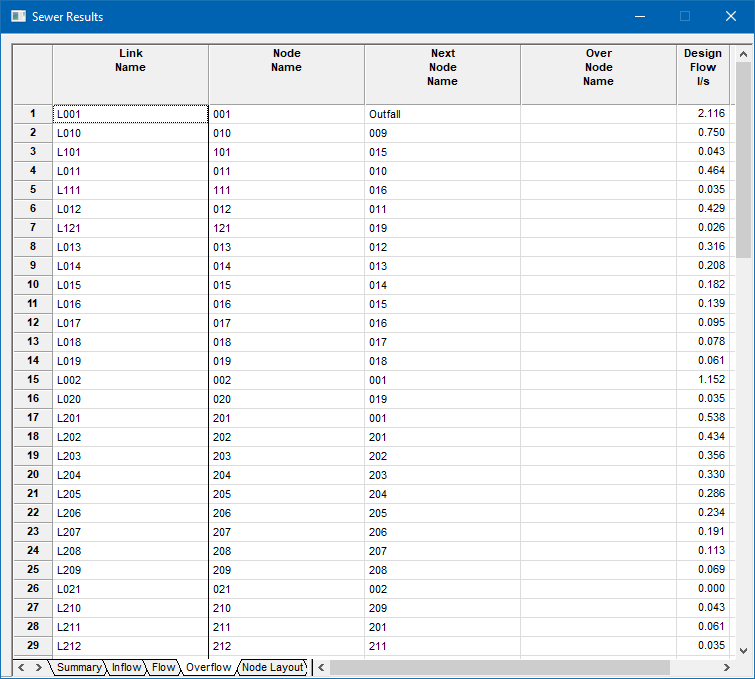
Data items include:
Link name
Node name
Next node name
Overflow node name
Inflow from the contributing units at this node in l/s
Point source inflow in l/s
Design flow in l/s which is the sum of all the contributing inflows upstream of this node
Actual flow transported by the link in l/s
Capacity of the link at the specified proportional depth in l/s
Overflow from the link in l/s, i.e. the difference between the design flow and the actual flow.
This function displays the results of the node analysis.
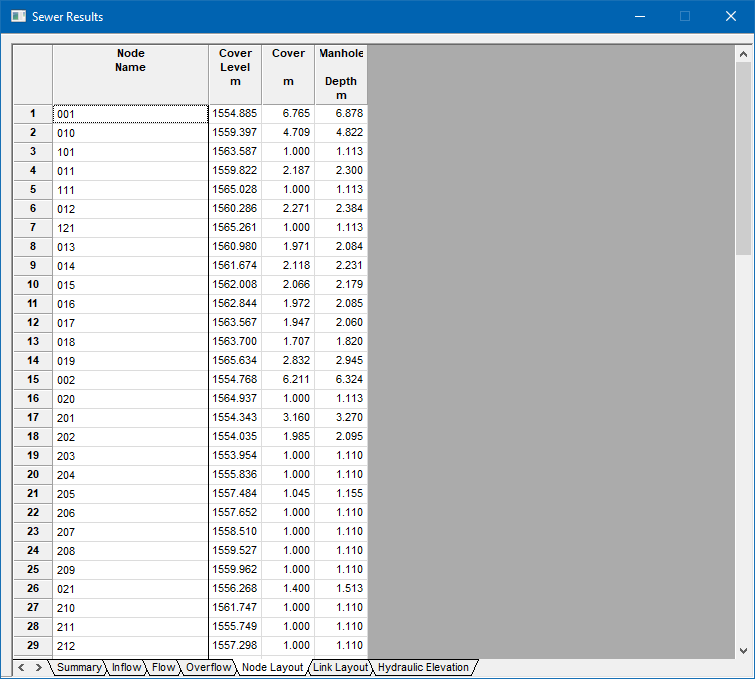
Data items include:
Node Name
Cover Level
Cover
Manhole Depth
This function displays the results of the link layout analysis. The data relating to the geometric position of the link.
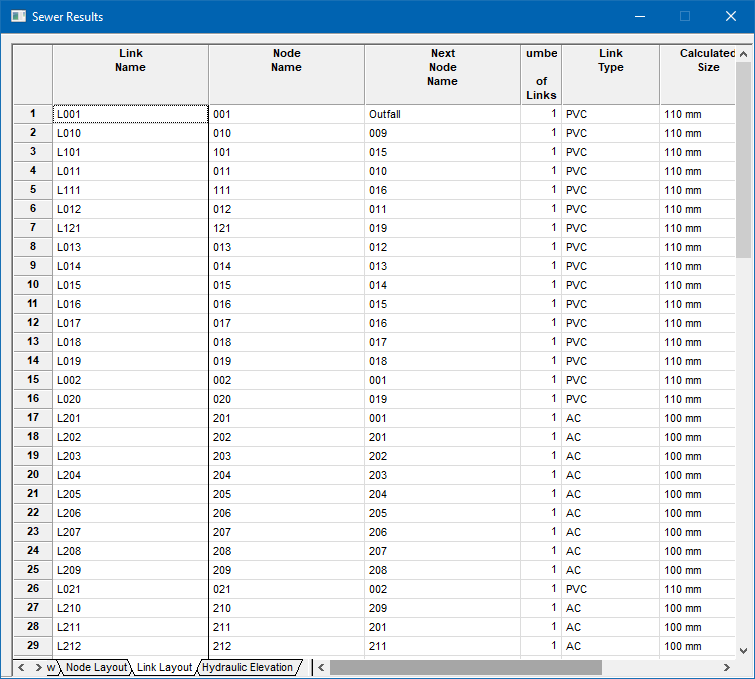
Data items include:
Link name
Node name
Next node name
Number of links
Link type
Calculated size in mm or the link description
Length in m
Slope of the link expressed as a percentage
Slope of the link expressed as a ratio
Inlet level of the link in m
Outlet level of the link in m
The height of the drop in the outflow manhole
 If the slope of a link is less than the minimum slope specified in the Link Tables, it displays in red. Similarly, if the slope is greater than the maximum slope specified in the Link Tables, it displays in blue.
This function displays the results of the hydraulic elevation analysis, including the elevation of the hydraulic grade line as well as other hydraulic control data.
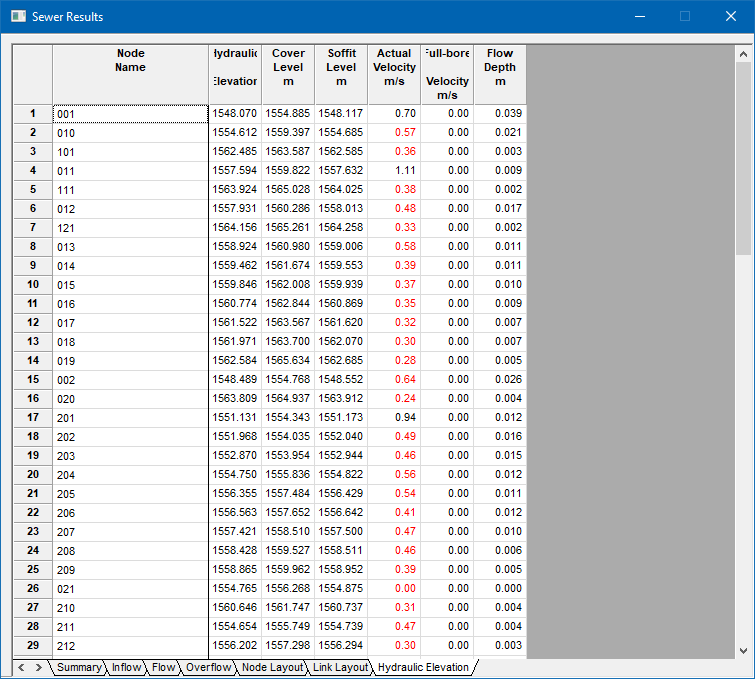
Data items include:
Node name
Hydraulic grade in m
Cover level of the node (manhole) in m
Soffit level of the link in m
Actual velocity of flow in m/s
Full-bore velocity of link in m/s
Flow depth in the link in m
 If the link velocity is less than the minimum velocity specified in the Design Parameters, it displays in red. Similarly, if the velocity is greater than the maximum velocity specified in the Design Parameters it displays in blue.