Home > Sewer Mode > Edit > Unit Flow Parameters
Edit the Unit Flow method design parameters.
|
Icon |
Command |
Shortcut Key |
Toolbar |
|
|
SEWEREDITUNITFLOWPARAMETERS |
|
|
The Unit Flow method is an empirical method, which assigns an inflow class to each type of contributing unit.
The number of contributing units of each class is specified at each node. The Sewer module calculates the peak design inflow from the information in the Unit Flow Class table, according to the following formula.

EF is omitted from the formula if the infiltration is specified per pipe length, and not as a percentage. In this case, the amount of infiltration is calculated separately according to the link lengths, and is added to the inflow after the inflow has been attenuated.
During the data input, you can assign up to five classes or types of inflow to any node i.e. you can allocate 45 low income dwelling units and 16 medium income units to a node.
A point source inflow (in litres/second) can also be allocated to the node, as well as the five inflow classes described above.
 The point source inflow and infiltration per pipe length are not attenuated.
The design module calculates the attenuation for the five inflow types, and then the design flow in litres per second for each class or type. These flows are then added, as well as the point source inflow if any.
The result is an inflow in litres per second, which is representative of all the contributing units at that node.
During the network analysis, the program keeps a total of all the units of each inflow class. At each node in the network, it calculates the total design flow as described above, as well as the total contributing population.
The design flow is attenuated according to the attenuation curve for the total contributing population at that point.
The attenuation factor is determined from the attenuation curve and the chosen peak factor. Read a Peak Factor (PFa) from the attenuation curve for the Population equivalent, and divide it by the chosen Peak Factor (PF).
Consider a manhole which has 322 low income dwelling units contributing to the inflow. Each low income dwelling unit has an average daily flow of 500 litres per dwelling unit per day, and an average total persons per dwelling unit of 7, as specified in the Inflow Class Table.
If you had specified the peak factor to be 2,5, and the percentage extraneous flow to be 15%, the design inflow is calculated as follows:

This figure has to be attenuated as the population equivalent is 2254 (that is 322 x 7). The attenuation factor is determined from the attenuation curve, in our case 0.860.
|
Attenuation Factor |
= PFa / PF |
= 2.15 / 2.5 |
|
|
|
= 0.860 |

Procedure
There are two pages in the Unit Inflow Parameters.
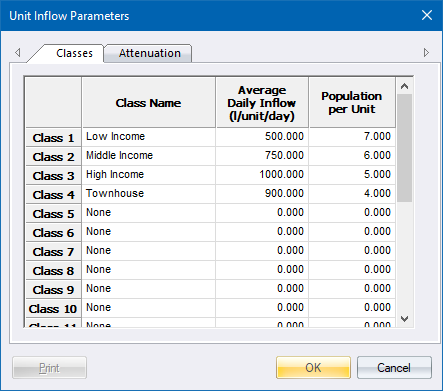
The Classes page of the Unit Inflow Parameters displays.

This page allows you to input or modify up to ten inflow classes to be used with the Unit Flow analysis. You are able to specify the following data for each inflow class:
Class Name - The name of the inflow class. This name displays in the inflow class combo box in the Node Data Editor.
Average Daily Inflow - The average daily inflow expressed in terms of litres per dwelling unit per day. This value is used to calculate the inflow into the system.
Population per Unit - The equivalent population per unit. This value is used to determine the total number of contributors, and hence the attenuation factor to apply to calculate the design flow.
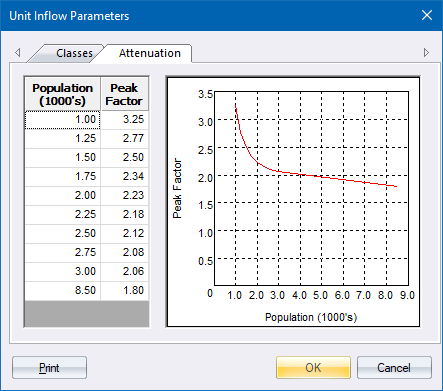
The Attenuation Page of the Unit Inflow Parameters displays.

This page allows you to change the standard attenuation curve to suit the characteristics of your particular region. The attenuation curve is used to determine the adjusted peak factor at any point in the network, according to the total contributing population at that point in the network.
Up to ten points can be input into the attenuation curve table. The graph is updated immediately.