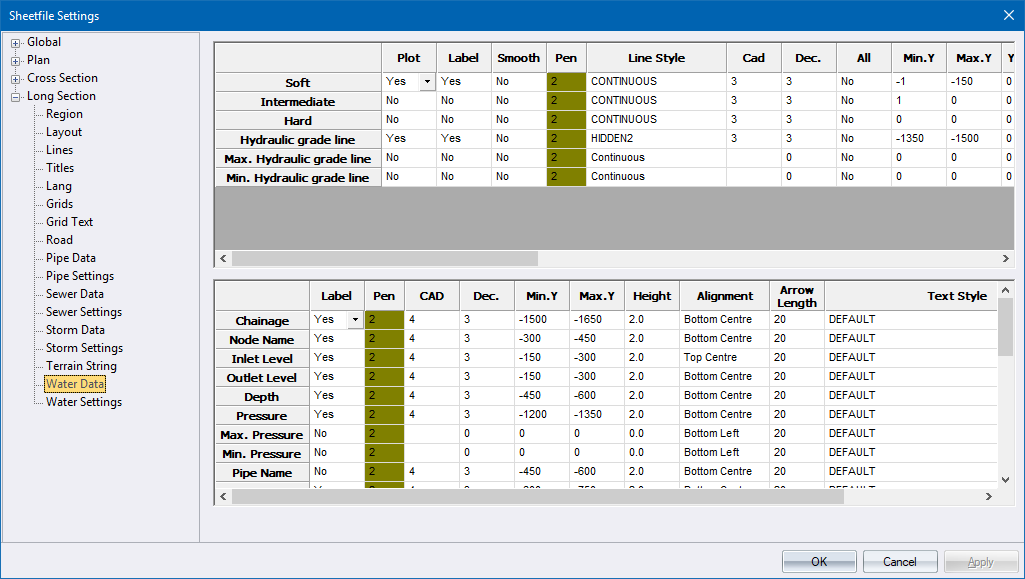
This page defines the plot settings for the section and detail areas for water long sections.
The first grid contains settings for the section and detail areas for the long section data. The row headings, other than Chainage, can be changed by double-clicking them. This then allows you to enter descriptive text for the row, which is displayed in the Long Section Setup as an aid to the data required for each particular line.
|
Option
|
Description |
|
Plot |
Select whether a line should be plotted in the section area for this data. |
|
Label |
Select whether a label should be generated in the detail area for this data. |
|
Smooth |
Select whether the plotted line should be smoothed with a Bezier curve. |
|
Pen |
Select the pen in which to plot the data line. Right-click the cell to display the pen selection. |
|
Line Style |
Enter the line type in which to plot the data line. |
|
CAD |
Enter the CAD layer on which the line should be plotted. |
|
Dec. |
Enter the number of decimal places to be used for the detail data. |
|
All |
Select whether a line point and/or data value should be generated for every point in this long section line (Yes) or only the bend manholes (No). |
|
Min. Y |
Enter the bottom coordinate of the area in which labels should be written relative to the datum line. Enter a value of 0 to use the Y Origin setting instead. |
|
Max. Y |
Enter the top coordinate of the area in which labels should be written relative to the datum line. Enter a value of 0 to use the Y Origin setting instead. |
|
Y Origin |
Enter the coordinate at which the label origins should be placed. This is an alternative method to using the Min Y and Max Y settings. |
|
Alignment |
Select the alignment of the label text. |
|
Exag |
Enter the chainage interval in metres at which data labels should be exaggerated. The text is written 60% greater than the specified size. |
|
Text Height |
Enter the height of label text in mm. |
|
Text Rot |
Enter the angle at which label text should be written in degrees. |
|
Text Pen |
Select the pen in which to plot the label text. Right-click the cell to display the pen selection. |
|
Underline |
Select whether a line should be drawn under the data label from the defined Min Y to the defined Max Y coordinates (Yes) or not (No). |
|
Drop |
Select whether a line should be drawn from the plotted data point down to the datum line (Yes) or not (No). |
|
Text Style |
Select the text style in which the text should be drawn. |
The second grid contains settings for the detail area for water elements.
|
Option
|
Description |
|
Label |
Select whether a data label should be generated for this sewer attribute. When toggling the Pipe Crossing option to Yes, specify the text that has to be written next to the crossing services using the Crossing Services Text. |
|
Pen |
Select the pen in which to plot the label text. Right-click the cell to display the pen selection. |
|
CAD |
Enter the CAD layer on which the data label should be plotted. |
|
Dec |
Enter the number of decimal places to be used for the labels. |
|
Min Y |
Enter the bottom coordinate of the area in which labels should be written relative to the datum line.
|
|
Max Y |
Enter the top coordinate of the area in which labels should be written relative to the datum line.
|
|
Height |
Enter the text height in mm. |
|
Alignment |
Select the alignment of the label text. |
|
Arrow Length |
Enter the length of the arrow head to be drawn for those data elements which use arrows. |
|
Text Style |
Select the text style in which the text should be drawn. |
 For fittings, the text tends to be long so it is best to place it on a drop line and not inside the table, by using positive values for Min. Y and Max. Y. These values can be equal but cannot be zero as they are not supported in sheet files.