Home > Long Section Road Data
This page defines the plot settings for the section and detail areas for road long sections.
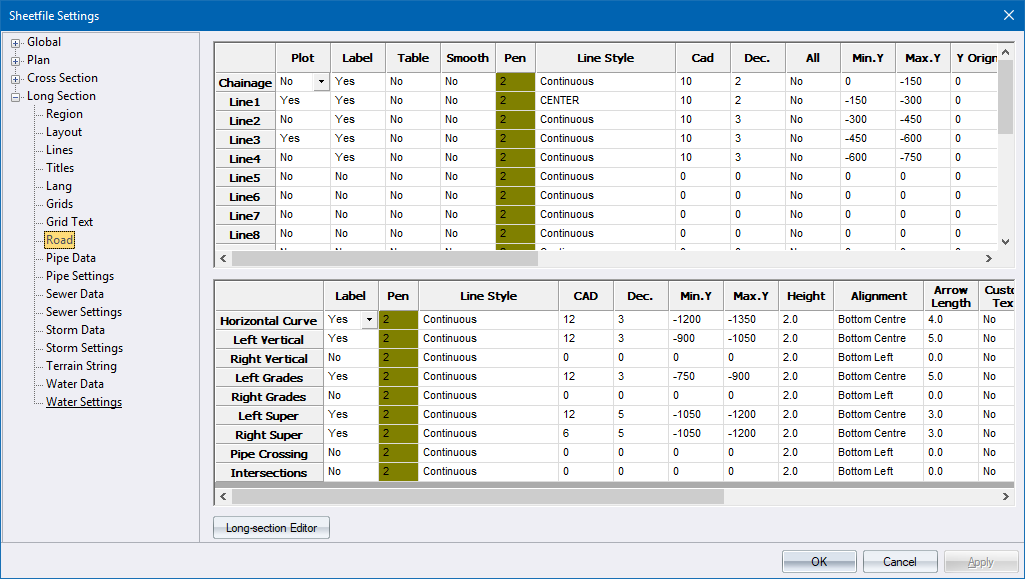
The first grid contains settings for the section and detail areas for the long section data. The row headings, other than Chainage, can be changed by double-clicking them. This allows you to enter descriptive text for the row, which is displayed in the Long Section Setup as an aid to the data required for each particular line.
|
Option
|
Description |
|
Plot |
Select whether a line should be plotted in the section area for this data. |
|
Label |
Select whether a label should be generated in the detail area for this data. |
|
Table |
Select whether a long section table should be plotted for this line. The Long Section Table is displayed. |
|
Smooth |
Select whether the plotted line should be smoothed with a bezier curve. |
|
Pen |
Select the pen in which to plot the data line. Right-click the cell to display the pen selection. |
|
Line Style |
Enter the line type in which to plot the data line. |
|
CAD |
Enter the CAD layer on which the line should be plotted. |
|
Dec |
Enter the number of decimal places to be used for the detail data. |
|
All |
Select whether a line point and/or data value should be generated for every point in this long section line (Yes) or only the bend mm (road chainage mm or manholes) (No). |
|
Min. Y |
Enter the bottom coordinate of the area in which labels should be written relative to the datum line. Enter a value of 0 to use the Y Origin setting instead. |
|
Max. Y |
Enter the top coordinate of the area in which labels should be written relative to the datum line. Enter a value of 0 to use the Y Origin setting instead. |
|
Y Origin |
Enter the coordinate at which the label origins should be placed. This is an alternative method to using the Min Y and Max Y settings. |
|
Alignment |
Select the alignment of the label text. |
|
Exag |
Enter the chainage interval in metres at which data labels should be exaggerated. The text is written 60% greater than the specified size. |
|
Text Height |
Enter the height of label text in mm. |
|
Text Rot |
Enter the angle at which label text should be written in degrees. |
|
Text Pen |
Select the pen in which to plot the label text. Right-click the cell to display the pen selection. |
|
Underline |
Select whether a line should be drawn under the data label from the defined Min Y to the defined Max Y coordinates (Yes) or not (No). |
|
Drop |
Select whether a line should be drawn from the plotted data point down to the datum line (Yes) or not (No). |
|
Round |
Enter a chainage rounding factor for the specific line. E.g. enter 100 if you want to display elevations on 100m intervals. |
|
Text Style |
Select the text style in which the text should be drawn. |
The second grid contains settings for the detail area for road elements.
|
Option
|
Description |
|
Label |
Select whether a data label should be generated for this road element (Yes/No). When toggling the Pipe Crossing option to Yes, specify the text that has to be written next to the crossing services using the Crossing Services Text. |
|
Pen |
Select the pen in which to plot the label text. Right-click the cell to display the pen selection. |
|
Line Style |
Enter the line style in which lines should be drawn. |
|
CAD |
Enter the CAD layer on which the data label should be plotted. |
|
Dec |
Enter the number of decimal places to be used for the labels. |
|
Min Y |
Enter the bottom coordinate of the area in which labels should be written relative to the datum line. |
|
Max Y |
Enter the top coordinate of the area in which labels should be written relative to the datum line. |
|
Height |
Enter the text height in mm. |
|
Alignment |
Select the alignment of the label text. |
|
Arrow Length |
Enter the length of the arrow head to be drawn for those data elements which use arrows. |
|
Custom Text |
Select whether a custom text entry should be generated for this road entry (Yes) or not (No). If you select Yes, a dialog displays which allows you to enter the custom text. Right-click the edit box(es) in this dialog to enter predefined variables. |
|
Max Super |
Enter the maximum superelevation value represented by the Min Y and Max Y entries. This is used to scale the superelevation to fit the defined area. This is only applicable to the Left and Right Super rows. |
|
Text Styles |
Select the text style in which the text should be drawn. |