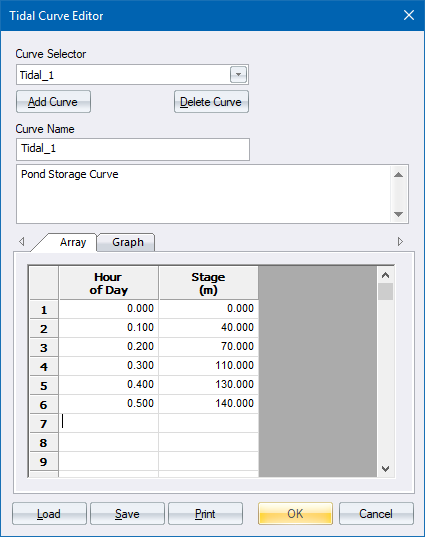

Input/edit and view storage curves. The curve describes how the stage at an outfall node changes by the hour of the day.
|
Option
|
Description |
|
Tidal Curve Selector |
Select the tidal curve to edit. |
|
Add Curve |
Click to add a new tidal curve to the project. |
|
Delete Curve |
Click to delete a tidal curve from the project. |
|
Tidal Curve Name |
User-assigned tidal curve name. |
|
Description |
An optional comment or description of the tidal curve. |
|
Array |
Table of hour of day versus stage. |
|
Graph |
View a graphical plot of the data in the array page. |
|
Load |
Click to load in a curve that was previously saved to file. |
|
Save |
Click to save the current curve's data to a file. |
|
|
Click to print the current window. |
|
OK Button |
Click to accept the current entries. |
|
Cancel Button |
Click to cancel the function. |
Table of the hour of the day versus the stage in m.

A graphical representation of the hour of day/stage curve.
