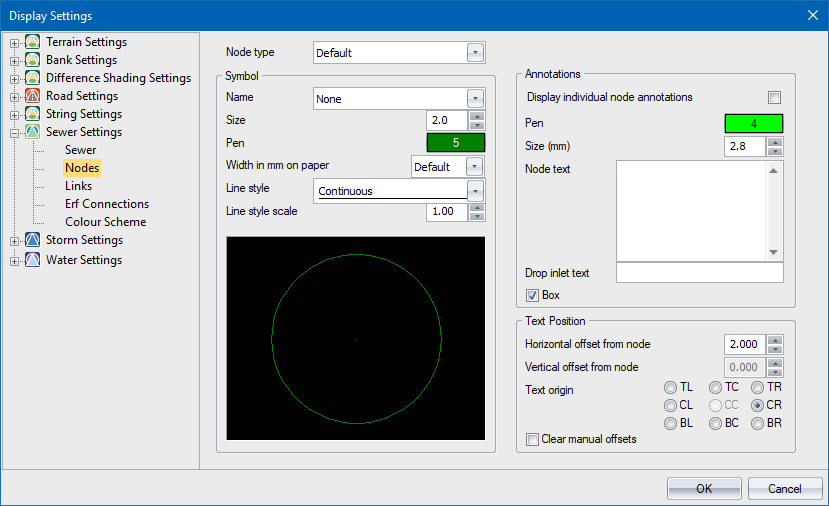
The node display settings allow you to display each individual node type with its own symbol, pen, line, style and annotations.
For convenience and backwards compatibility, the Display individual node annotations option must be selected to enable different annotations for each node type. If it is not selected, the display will be the same as earlier versions.
Option
|
Description |
Node type |
Select the node type for specific display settings. Each node type can be drawn as a circle or a user-defined symbol with a unique pen, size, line width, line style and annotations. The node types are defined in the Node Types option. |
Symbol |
|
Name |
Select the node symbol name for the selected node type. The symbols are defined in the SewerSymbol.dwg file. The symbol file will be in the ProgramData directory unless the SetSharedFolder utility has be used to set a shared network resource.
|
Size |
Specify the size of the circle or symbol in mm on paper. Use the arrows to step through a list of available sizes. |
Pen |
The node is displayed as a circle in the specified colour. To change the colour, click the button and select a colour from the Colour settings. |
Width in mm on paper |
Specify the line width of the node symbol line in mm. |
Line Style |
Specify the line type the circle must be drawn in from the list. |
Line Style Scale |
Specify the scale for the node symbol line style. Use the arrows to step through a list of available values. |
Preview |
Displays a preview of what the node will look like. |
Annotations |
|
Display individual node annotations |
Select this checkbox to enable the setting up and display of individual node annotations for each node type. Leave unselected for the node annotations to be uniform across node types. You can switch between uniform and individual annotations by selecting/unselecting this option. |
Pen |
The node annotations are displayed in the specified colour. To change the colour, click the button and select a colour from the Colour settings. |
Size (mm) |
Specify the node annotation text size in points. |
Node text |
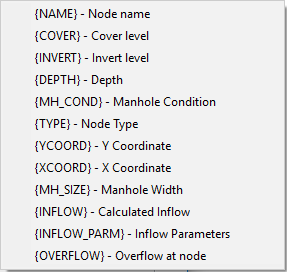
Enter the text to be written as annotation at each node. A number of variables are available.
Right-click the relevant cell to select from a menu. |
Drop Inlet text |
Enter the text to be written as annotation at the nodes with drop inlets; or right-click and select the {DROPINLET} variable. This will add the level of the drop inlet and the upstream node name for the relevant link in brackets. |
Box |
Select this checkbox to have a box filled in the current drawing background colour placed behind the annotation text. This is a useful option if you want to blank out portions of the underlying data in order to highlight the text. |
Text Position - the text position settings are applied to all node annotations globally. |
|
Horizontal offset from node |
Specify an offset in metres horizontally from the actual node position at which the annotation text origin should be placed. |
Vertical offset from node |
Specify an offset in metres vertically from the actual node position at which the annotation text origin should be placed. |
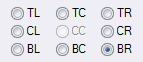
Text origin |
Select one of the eight available positions for the annotation text origin.
The centre position is the actual node position. |
Clear manual offsets |
Select this checkbox to reset the offset of the text from the nodes if you have manually changed the individual offsets. |
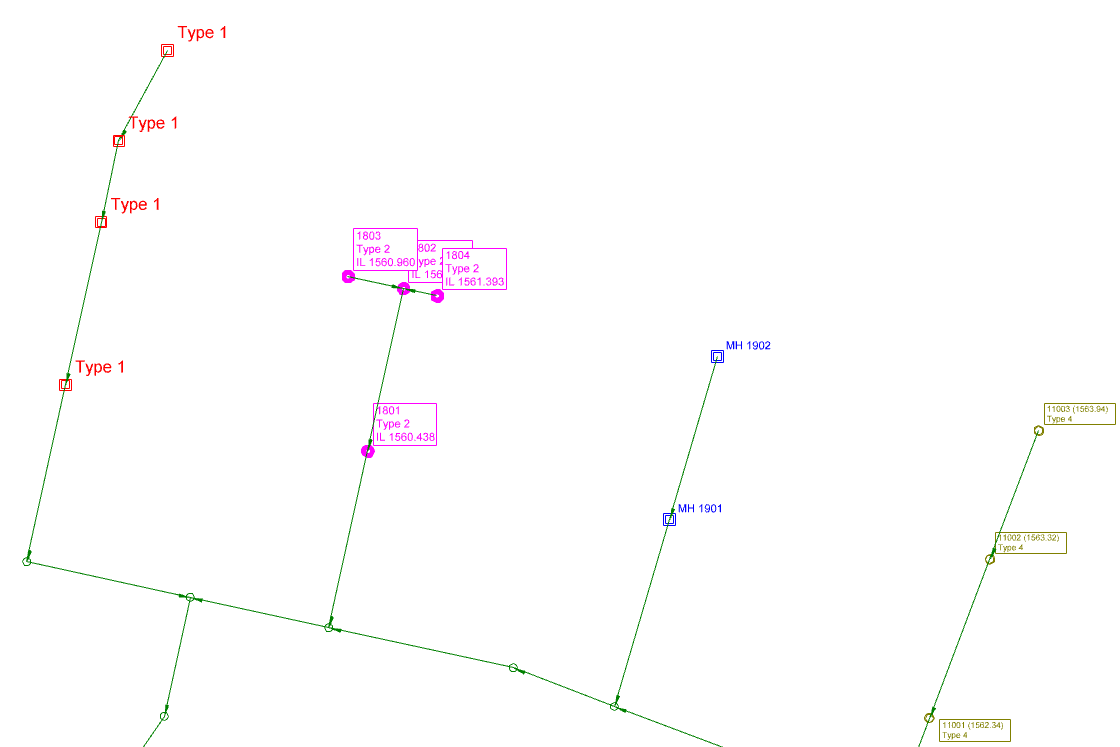
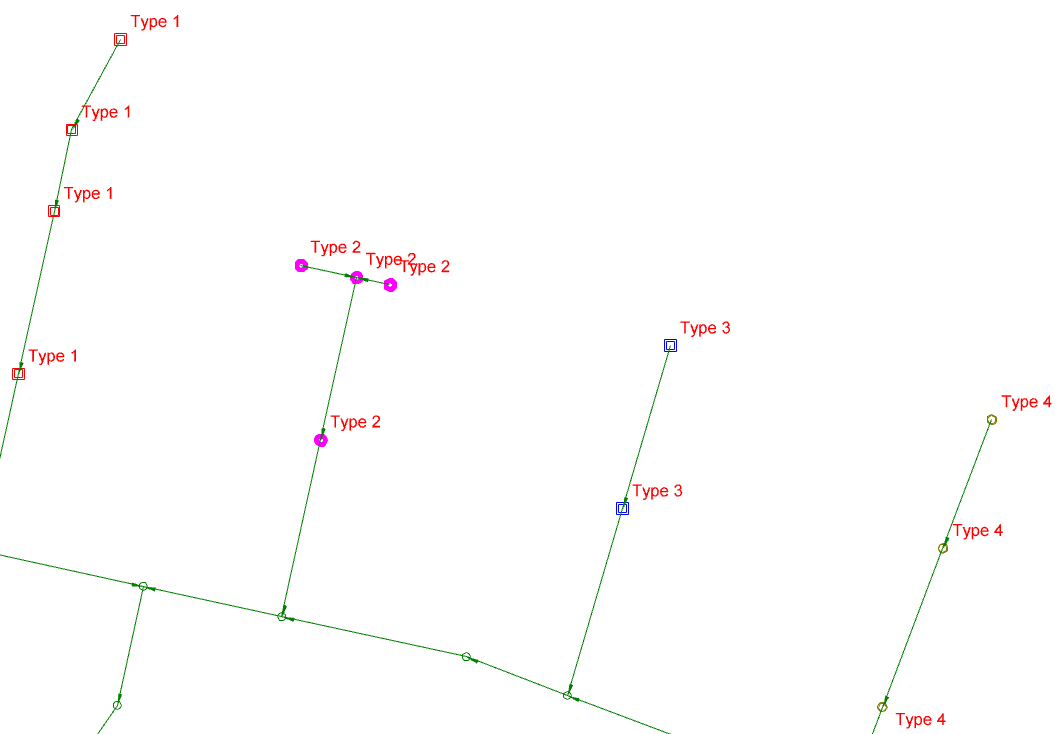
In the example below, each branch is a different node type, as defined in the Node Type tables. The Display individual node annotations option is selected.
The same data with the Display individual node annotations option not selected. The nodes display the same default text regardless of type.
 If the symbol